Editing Evolved
Visual Studio Code features a battle-tested code editor that has most of the industry standard features, but also has some delights. We've been using it to build VS Code and we hope you'll love it too. This topic will walk you through some of the notable features of the code editor.
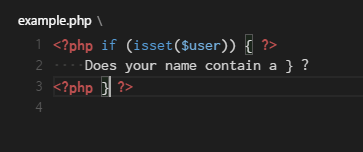
Bracket matching
Matching brackets will be highlighted as soon as the cursor is near one of them. The right bracket will always be found, regardless of embedded languages.
Tip: You can jump to the matching bracket with
kb(editor.action.jumpToBracket)
Selection & Multi-cursor
VS Code has support for multiple cursors. You can add secondary cursors (rendered thinner) with kbstyle(Alt+Click). Each cursor operates independently based on the context it sits in. The most common way to add more cursors is with kb(editor.action.insertCursorBelow) or kb(editor.action.insertCursorAbove) that insert cursors below or above.
kb(editor.action.addSelectionToNextFindMatch) selects the word at the cursor, or the next occurrence of the current selection. kb(editor.action.moveSelectionToNextFindMatch) moves the last added cursor to next occurrence of the current selection.
Tip: You can add more cursors also with
kb(editor.action.selectHighlights), which will add a selection at each occurrence of the current selected text or withkb(editor.action.changeAll), which will add a selection at each occurrence of the current word.
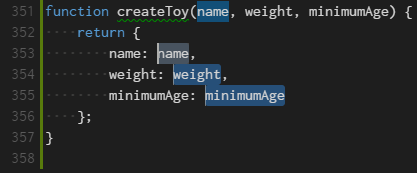
Shrink/expand selection
Quickly shrink or expand the current selection (applies to all languages). Trigger it with kb(editor.action.smartSelect.shrink) and kb(editor.action.smartSelect.grow)
Here's an example of expanding the selection with kb(editor.action.smartSelect.grow):
IntelliSense
We'll always offer word completion, but for the rich languages, such as JavaScript, JSON, HTML, CSS, Less, Sass, C# and TypeScript, we offer true IntelliSense experience. If a language service knows possible completions, the IntelliSense suggestions will pop up as you type (we call it affectionately 24x7 IntelliSense). You can always manually trigger it with kb(editor.action.triggerSuggest). Out of the box, kbstyle(.), kbstyle(Tab) or kbstyle(Enter) are accept triggers but you can also customize these key bindings.
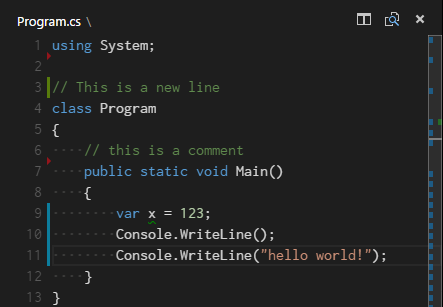
Tip: The suggestions filtering supports CamelCase so you can type the upper case letters of a method name to limit the suggestions. For example, "wl" will quickly bring up WriteLine.
Tip: The 24x7 IntelliSense can be configured via the
editor.quickSuggestionsandeditor.suggestOnTriggerCharacterssettings.
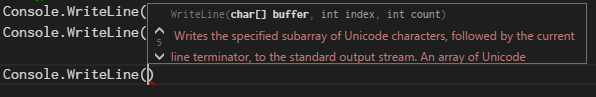
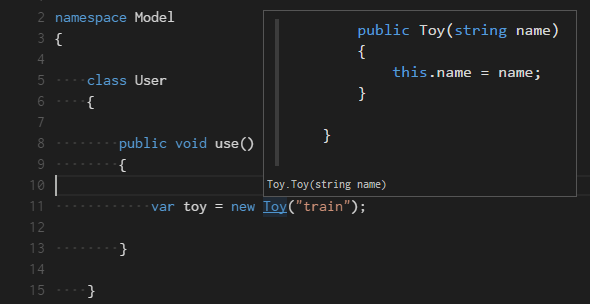
Parameter Hints
In JavaScript, TypeScript or C#, parameter hints will pop up as you're typing a method invocation. You can navigate between different overloads with kbstyle(Up) and kbstyle(Down) and the best overload will be presented based on the arguments you pass in.
Snippets and Emmet Abbreviations
We offer built-in snippets across languages as well as support for Emmet abbreviations. You can expand Emmet abbreviations in HTML, Razor, CSS, Less, Sass, XML or Jade with kbstyle(Tab).
(See the Emmet cheat sheet for syntax examples.)
You can also define your own snippets: Open User Snippets under File | Preferences and select the language for which the snippets should appear. Find out more about this in the customization section of our docs.
Go to Definition
If a language supports it, you can go to the definition of a symbol by pressing kb(editor.action.goToDeclaration).
If you press kbstyle(Ctrl) and hover over a symbol, a preview of the declaration will appear:
Tip: You can jump to the definition with
kbstyle(Ctrl+Click)or open the definition to the side withkbstyle(Ctrl+Alt+Click).
Goto Symbol
You can navigate symbols inside a file with kb(workbench.action.gotoSymbol). By typing kbstyle(:) the symbols will be grouped by category. Just press kbstyle(Up) or kbstyle(Down) and navigate to the place you want.
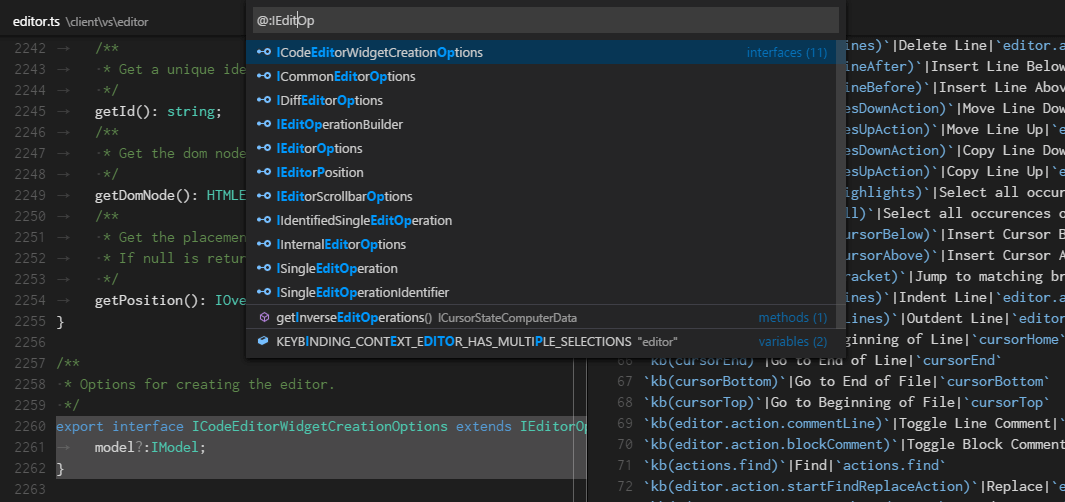
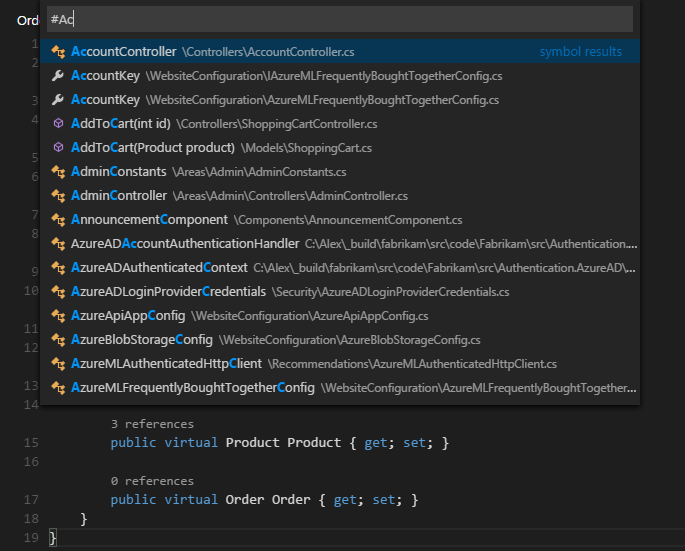
Open symbol by name
In C# and in TypeScript, you can jump to a symbol across files with kb(workbench.action.showAllSymbols). Just type the first letter of a type you want to navigate to, regardless of which file contains it, and press kbstyle(Enter).
Gutter indicators
If you open a folder that is a Git repository and begin making changes, VS Code will add useful annotations to the gutter and to the overview ruler. A red triangle indicates where lines have been deleted A green bar indicates new added lines * A blue bar indicates modified lines
Peek
We think there's nothing worse than a big context switch when all you want is to quickly check something. That's why we support peeked editors. When you execute a Reference Search (via kb(editor.action.referenceSearch.trigger)), or a Peek Definition (via kb(editor.action.previewDeclaration)), we embed the result inline:
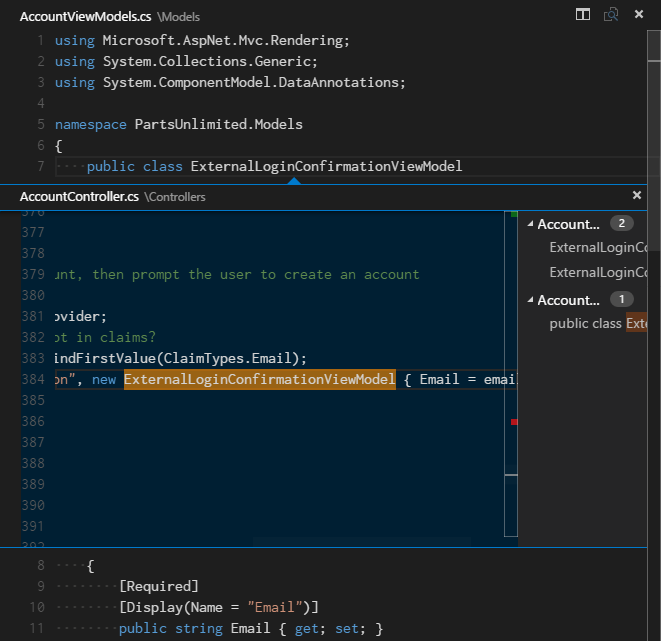
Tip: You can navigate between different references in the peeked editor and, if you need to, you can even make quick edits right there!
Tip: Clicking on the peeked editor filename or double-clicking in the result list will open the reference in the outer editor.
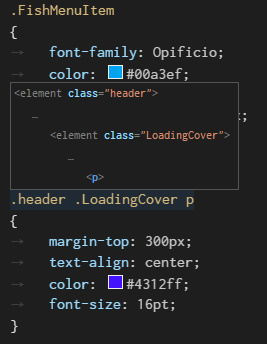
Hover
For languages that support it, the hover will show useful information, such as types of symbols, or, in the case of CSS below, the shape of the HTML that would match a certain CSS rule:
Reference information
C# supports inline reference information, that is live updated. This allows you to quickly analyze the impact of your edit or the popularity of your specific method or property throughout your project:
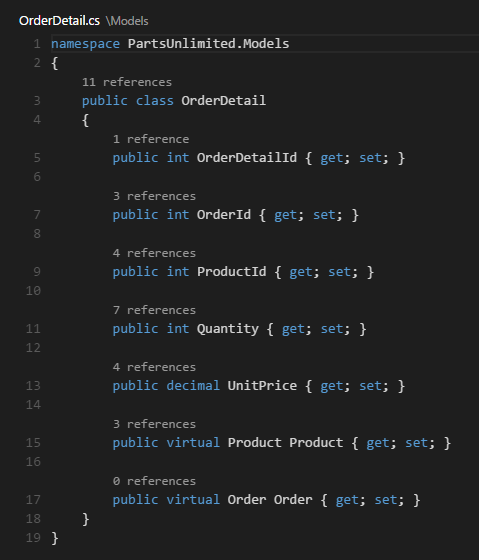
Tip: Directly invoke the Find References action by clicking on these annotations.
Tip: Reference information can be turned on or off through the
editor.referenceInfossetting.
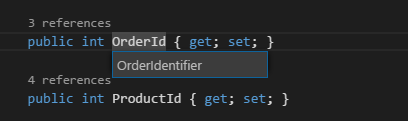
Rename symbol
TypeScript and C# support rename symbol across files. Simply press kb(editor.action.rename) and then type the new desired name and press kbstyle(Enter). All usages of the symbol will be renamed, across files.
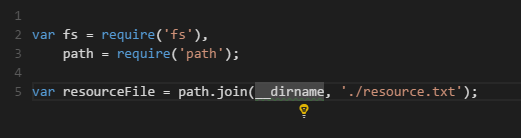
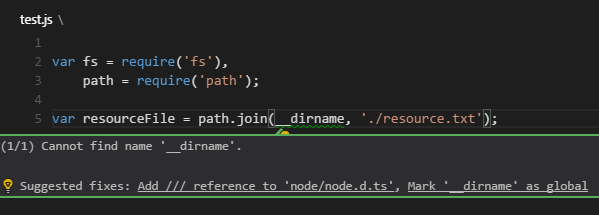
Code action
JavaScript and CSS support code actions. A lightbulb will appear if there is a code action for the problem under the cursor. In this JavaScript example, due to the usage of __dirname, which is a Node.js built-in variable, the code action will propose to download and add a reference to node.d.ts, which contains all Node.js definitions.
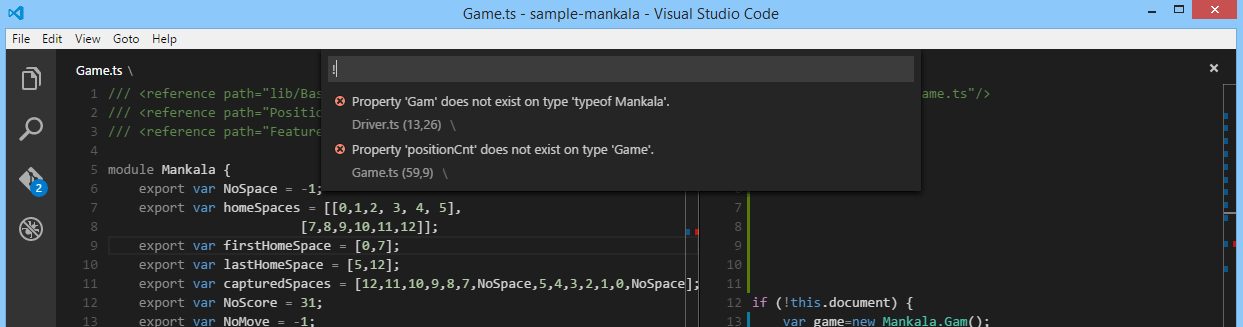
Errors & Warnings
Warnings or Errors can be generated either via configured tasks or by the rich language services, that constantly analyze your code in the background. Since we love bug-free code, warnings and errors show up in multiple places:
In the status line there is a summary of all errors and warnings counts.
You can click on the summary or press kb(workbench.action.showErrorsWarnings) to see a list of all current errors.
* If you open a file that has errors or warnings, they will be rendered inline with the text and in the overview ruler.
Tip: To loop through errors or warnings in the current file, you can press
kb(editor.action.marker.next)orkb(editor.action.marker.prev)which will show an inline zone detailing the problem and possible code actions (if available):
Next Steps
Now that you know how the editor works, time to try a few other things...
- Why VS Code - Why we exist and where we think we can help
- The Basics - Basic orientation around VS Code
- Debugging - This is where VS Code really shines
- Customization - Configure VS Code the way you want - Themes, Settings